产品: LC3B 抗体
货号: AF4650
描述: Rabbit polyclonal antibody to LC3B
应用: WB IHC IF/ICC
反应: Human, Mouse, Rat
预测: Pig, Zebrafish, Bovine, Sheep, Dog, Xenopus
分子量: 14kDa,16kDa; 15kD(Calculated).
蛋白号: Q9GZQ8
RRID: AB_2844592

浏览相似产品>>

   规格 价格 库存
 50ul RMB¥ 1250 现货
 100ul RMB¥ 2300 现货
 200ul RMB¥ 3000 现货

货期: 当天发货

联系销售

产品描述

来源:
Rabbit
应用:
WB 1:500-1:2000, IF/ICC 1:100-1:500, IHC 1:50-1:200
*The optimal dilutions should be determined by the end user.
*Tips:

WB: 适用于变性蛋白样本的免疫印迹检测. IHC: 适用于组织样本的石蜡(IHC-p)或冰冻(IHC-f)切片样本的免疫组化/荧光检测. IF/ICC: 适用于细胞样本的荧光检测. ELISA(peptide): 适用于抗原肽的ELISA检测.

反应:
Human,Mouse,Rat
预测:
Pig(100%), Zebrafish(92%), Bovine(100%), Sheep(100%), Dog(100%), Xenopus(100%)
克隆:
Polyclonal
特异性:
LC3B Antibody detects endogenous levels of total LC3B.
RRID:
AB_2844592
引用格式: Affinity Biosciences Cat# AF4650, RRID:AB_2844592.
偶联:
Unconjugated.
纯化:
The antiserum was purified by peptide affinity chromatography using SulfoLink™ Coupling Resin (Thermo Fisher Scientific).
保存:
Rabbit IgG in phosphate buffered saline , pH 7.4, 150mM NaCl, 0.02% sodium azide and 50% glycerol. Store at -20 °C. Stable for 12 months from date of receipt.
别名:

展开/折叠

ATG8F; Autophagy-related protein LC3 B; Autophagy-related ubiquitin-like modifier LC3 B; LC3B; LC3II; MAP1 light chain 3 like protein 2; MAP1 light chain 3-like protein 2; MAP1A/1BLC3; MAP1A/MAP1B LC3 B; MAP1A/MAP1B light chain 3 B; MAP1ALC3; MAP1LC3B a; Map1lc3b; Microtubule associated protein 1 light chain 3 beta; Microtubule-associated protein 1 light chain 3 beta; Microtubule-associated proteins 1A/1B light chain 3B; MLP3B_HUMAN;

抗原和靶标

免疫原:
Uniprot:
基因/基因ID:
表达:
Q9GZQ8 MLP3B_HUMAN:

Most abundant in heart, brain, skeletal muscle and testis. Little expression observed in liver.

序列:
MPSEKTFKQRRTFEQRVEDVRLIREQHPTKIPVIIERYKGEKQLPVLDKTKFLVPDHVNMSELIKIIRRRLQLNANQAFFLLVNGHSMVSVSTPISEVYESEKDEDGFLYMVYASQETFGMKLSV

种属预测

种属预测:

score>80的预测可信度较高,可尝试用于WB检测。*预测模型主要基于免疫原序列比对,结果仅作参考,不作为质保凭据。

Species
Results
Score
Pig
100
Bovine
100
Sheep
100
Dog
100
Xenopus
100
Zebrafish
92
Horse
0
Chicken
0
Rabbit
0
Model Confidence:
High(score>80) Medium(80>score>50) Low(score<50) No confidence

翻译修饰 - Q9GZQ8 作为底物

Site PTM Type Enzyme
K5 Ubiquitination
T6 Phosphorylation
R21 Methylation
T29 Phosphorylation
K30 Ubiquitination
K42 Ubiquitination
K49 Ubiquitination
K51 Ubiquitination
K65 Ubiquitination

研究背景

功能:

Ubiquitin-like modifier involved in formation of autophagosomal vacuoles (autophagosomes). Plays a role in mitophagy which contributes to regulate mitochondrial quantity and quality by eliminating the mitochondria to a basal level to fulfill cellular energy requirements and preventing excess ROS production. Whereas LC3s are involved in elongation of the phagophore membrane, the GABARAP/GATE-16 subfamily is essential for a later stage in autophagosome maturation. Promotes primary ciliogenesis by removing OFD1 from centriolar satellites via the autophagic pathway. Through its interaction with the reticulophagy receptor TEX264, paticipates in the remodeling of subdomains of the endoplasmic reticulum into autophagosomes upon nutrient stress, which then fuse with lysosomes for endoplasmic reticulum turnover.

翻译修饰:

The precursor molecule is cleaved by ATG4B to form the cytosolic form, LC3-I. This is activated by APG7L/ATG7, transferred to ATG3 and conjugated to phospholipid to form the membrane-bound form, LC3-II.

The Legionella effector RavZ is a deconjugating enzyme that produces an ATG8 product that would be resistant to reconjugation by the host machinery due to the cleavage of the reactive C-terminal glycine.

Phosphorylation at Thr-12 by PKA inhibits conjugation to phosphatidylethanolamine (PE) (By similarity). Interaction with MAPK15 reduces the inhibitory phosphorylation and increases autophagy activity.

细胞定位:

Cytoplasm>Cytoskeleton. Endomembrane system>Lipid-anchor. Cytoplasmic vesicle>Autophagosome membrane>Lipid-anchor. Cytoplasmic vesicle>Autophagosome.
Note: LC3-II binds to the autophagic membranes. Localizes also to discrete punctae along the ciliary axoneme (By similarity).

Extracellular region or secreted Cytosol Plasma membrane Cytoskeleton Lysosome Endosome Peroxisome ER Golgi apparatus Nucleus Mitochondrion Manual annotation Automatic computational assertionSubcellular location
组织特异性:

Most abundant in heart, brain, skeletal muscle and testis. Little expression observed in liver.

亚基结构:

3 different light chains, LC1, LC2 and LC3, can associate with MAP1A and MAP1B proteins (By similarity). Interacts at microtubules with CABP1 (via EF-hands 1 and 2) but not with calmodulin. Interacts with FYCO1 (via C-terminus). Interacts with TP53INP1 and TP53INP2. Interacts with TBC1D25. Directly interacts with SQSTM1; this interaction leads to MAP1LC3B recruitment to inclusion bodies containing polyubiquitinated protein aggregates and to inclusion body degradation by autophagy. Interacts with ATG4B, MAPK15 and BNIP3. Interacts with MAPB1, KEAP1, PCM1, OFD1, CEP131, and TECPR2. Interacts with TBC1D5. Found in a complex with UBQLN1 and UBQLN2. Interacts with UBQLN4 (via STI1 1 and 2 domains). Interacts with UBQLN1 in the presence of UBQLN4. Interacts with ATG13. Interacts with RETREG2, RETREG1 and RETREG3. No interaction, or very weak, with WDFY3. Interacts with PLCL1; the interaction inhibits autophagosome formation (By similarity). Interacts with TRIM16. Interacts with CRY1 and PER2 (By similarity). Interacts with the reticulophagy receptor TEX264.

蛋白家族:

Belongs to the ATG8 family.

研究领域

· Cellular Processes > Cell growth and death > Ferroptosis.   (View pathway)

文献引用

1). Sirt3-mediated mitophagy regulates AGEs-induced BMSCs senescence and senile osteoporosis. Redox Biology (PubMed: 33662874) [IF=11.4]

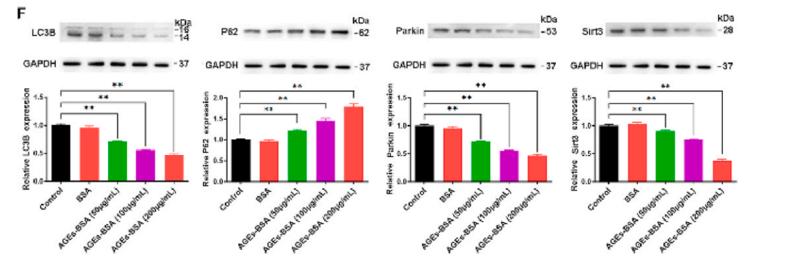
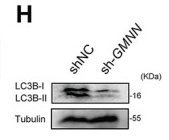
Application: WB    Species: mice    Sample: bone marrow mesenchymal stem (BMSCs)

Fig. 2. Effects of different concentrations of AGEs on mitochondrial function and mitophagy of BMSCs. The BMSCs were treated with AGEs (50–200 μg/mL) or BSA for 24–72 h. (A) Representative fluorescence images with DCF (green) staining in BMSCs stimulated with AGEs. Scale bar: 50 μm. (B) Representative fluorescence images with Mito-SOX (red) and Mito-Tracker (green) double-staining in BMSCs stimulated with AGEs. Scale bar: 50 μm. (C) The MMP was detected through JC-1 staining in BMSCs stimulated with AGEs. Scale bar: 50 μm. (D) Representative fluorescence images with Mtphagy Dye (red) and Mito-Tracker (green) double-staining in BMSCs stimulated with AGEs. Scale bar: 50 μm. (E) Representative fluorescence images with LC3B (red) and Mito-Tracker (green) double-staining in BMSCs stimulated with AGEs. Scale bar: 50 μm. (F) Representative Western blotting assay and quantitation of the level of LC3B, P62, Parkin, Sirt3. **p < 0.01 versus BSA. (For interpretation of the references to colour in this figure legend, the reader is referred to the Web version of this article.)

2). Activation of aldehyde dehydrogenase-2 improves ischemic random skin flap survival in rats. Frontiers in Immunology (PubMed: 37441072) [IF=7.3]

Application: IF/ICC    Species: Mouse    Sample:

Figure 10 Immunofluorescence images of Beclin-1 (A), p62 (B), and LC3(C) were captured under fluorescence microscopy, and the relative fluorescence intensity was calculated. All images were obtained at identical magnification, ×200, scale bar = 50 μm. Data are represented as mean ± SEM (n = 3). **P

3). Role of the mTOR Signalling Pathway in Human Sepsis-Induced Myocardial Dysfunction. CANADIAN JOURNAL OF CARDIOLOGY (PubMed: 31292086) [IF=6.2]

4). Enterovirus 71 induces autophagy in mice via mTOR inhibition and ERK pathway activation. LIFE SCIENCES (PubMed: 33581126) [IF=6.1]

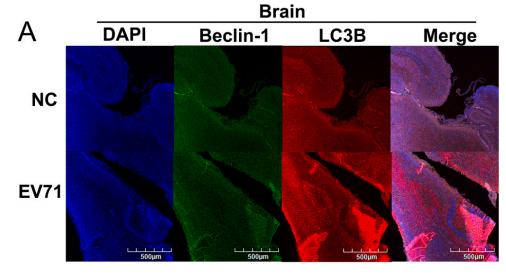
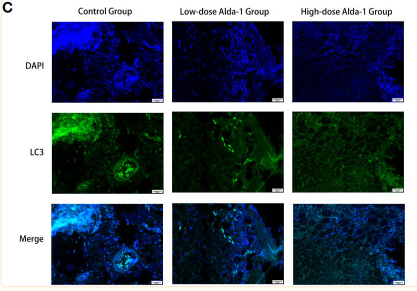
Application: IF/ICC    Species: Mice    Sample: brain tissue

Fig. 2. EV71 induces autophagy in mice. (A) Immunofluorescence staining of Beclin-1 and LC3B in the brain of mice. Images of the brain (left) and statistic results (right). Scale bar: 500 μm (B) Immunofluorescence staining of Beclin-1 and LC3B in the lung of mice. Images of the lung (left) and statistic results (right). Scale bar: 500 μm (C) The expression of LC3B and VP1 in the brain. Scale bar: 50 μm (D) The expression of LC3B and VP1 in the lung. Scale bar: 50 μm (E) The expression of Beclin-1 and LC3B in the brain. (F) The expression of Beclin-1 and LC3B in the lung of mice. NC: normal control group; EV71: Enterovirus 71 infected group; NC: n = 10; EV71: n = 10; *P < 0.05; **P < 0.01.

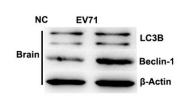
Application: WB    Species: Mice    Sample: brain tissue

Fig. 2. EV71 induces autophagy in mice. (A) Immunofluorescence staining of Beclin-1 and LC3B in the brain of mice. Images of the brain (left) and statistic results (right). Scale bar: 500 μm (B) Immunofluorescence staining of Beclin-1 and LC3B in the lung of mice. Images of the lung (left) and statistic results (right). Scale bar: 500 μm (C) The expression of LC3B and VP1 in the brain. Scale bar: 50 μm (D) The expression of LC3B and VP1 in the lung. Scale bar: 50 μm (E) The expression of Beclin-1 and LC3B in the brain. (F) The expression of Beclin-1 and LC3B in the lung of mice. NC: normal control group; EV71: Enterovirus 71 infected group; NC: n = 10; EV71: n = 10; *P < 0.05; **P < 0.01.

5). Inhibition of GSK3β Reduces Ectopic Lipid Accumulation and Induces Autophagy by the AMPK Pathway in Goat Muscle Satellite Cells. Cells (PubMed: 31683987) [IF=6.0]

6). Polysaccharides of Dendrobium officinale Kimura & Migo Leaves Protect Against Ethanol-Induced Gastric Mucosal Injury via the AMPK/mTOR Signaling Pathway in Vitro and vivo. Frontiers in Pharmacology (PubMed: 33262700) [IF=5.6]

Application: WB    Species: Rat    Sample:

Figure 5 The representative western blot images of LC3β, HO-1, Beclin-1, p-AMPK, p62, p-mTOR and immunohistochemical image of LC3β showed that LDOP-1 induced autophagy via AMPK/mTOR signaling way in vivo. (A) The expression of LC3β, HO-1, Beclin-1, p-AMPK, p62, p-mTOR detected by Western blot. (B-G) Statistical analysis on LC3β, HO-1, Beclin-1, p-AMPK, p62, p-mTOR. Immunohistochemical image of LC3β (H) measured by immunohistochemical analysis (400×, brown yellow granules indicate positive reaction). Data are expressed as the mean  ±  SD of three independent experiments. #P < 0.05, ##P < 0.01, ###P < 0.001 compare the control group; *P < 0.05 and **P < 0.01 compare model group. LDOP-L stood for LDOP-1-L, LDOP-H stood for LDOP-1-H.

Application: IHC    Species: Rat    Sample:

Figure 5 The representative western blot images of LC3β, HO-1, Beclin-1, p-AMPK, p62, p-mTOR and immunohistochemical image of LC3β showed that LDOP-1 induced autophagy via AMPK/mTOR signaling way in vivo. (A) The expression of LC3β, HO-1, Beclin-1, p-AMPK, p62, p-mTOR detected by Western blot. (B-G) Statistical analysis on LC3β, HO-1, Beclin-1, p-AMPK, p62, p-mTOR. Immunohistochemical image of LC3β (H) measured by immunohistochemical analysis (400×, brown yellow granules indicate positive reaction). Data are expressed as the mean  ±  SD of three independent experiments. #P < 0.05, ##P < 0.01, ###P < 0.001 compare the control group; *P < 0.05 and **P < 0.01 compare model group. LDOP-L stood for LDOP-1-L, LDOP-H stood for LDOP-1-H.

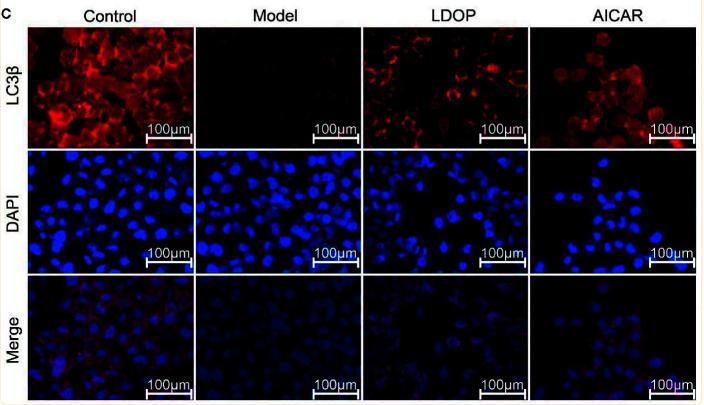
Application: IF/ICC    Species: Rat    Sample:

Figure 9 The expression of LC3β when treated with 2 %, 4 %, 6 %, 8 % concentration ethanol for 0.5 h, 1 h, 1.5 h, 2 h and effects of LDOP-1 on it. (A) The expression of LC3β at the ethanol at concentrations of 2 %, 4 %, 6 %, 8 %. (B) The expression of LC3β for 0.5 h, 1 h, 1.5 h. (C) Immunofluorescence image of LC3β measured by immunofluorescence technique (GES-1 were treated with 8% ethanol for 2 h after pretreatment with LDOP-1). Data are expressed as the mean ± SD of three independent experiments. *P < 0.05 and **P < 0.01 compare to 2 % concentrations ethanol or 0.5 h group. LDOP stood for LDOP-1.

7). Lysophosphatidic acid suppresses apoptosis of high-grade serous ovarian cancer cells by inducing autophagy activity and promotes cell-cycle progression via EGFR-PI3K/Aurora-AThr288-geminin dual signaling pathways. Frontiers in Pharmacology (PubMed: 36601056) [IF=5.6]

Application: WB    Species: Human    Sample: A2780 cells

FIGURE 1 Depletion of geminin suppresses autophagy activity, enhances ROS production, and induces the apoptosis of HGSOC cells. (A) Immunoblotting analysis of geminin protein levels in A2780 cells as indicated. shNC, A2780 cells transfected with shNC; sh-GMNN, geminin-knockout A2780 cells transfected with shRNA. Quantification of three independent experiments was performed, normalized to tubulin, and expressed as a ratio of NC, mean ± SEM, Student’s unpaired t-test, ***p < 0.001. (B) IB analysis of apoptosis-related proteins’ expression levels in A2780 cells as indicated. Mean ± SEM, n = 3, Student’s unpaired t-test, **p < 0.01, ***p < 0.001, ns—non-significant. (C) Apoptosis analysis of A2780 cells under geminin depletion. The percentage of apoptotic cells was analyzed with flow cytometry. Mean ± SEM, n = 3, Student’s unpaired t-test, ***p < 0.001. (D) Representative phase-contrast images of bioreactor expanded A2780 cells at indicated days of cultivation. Scale bar 20 μm. (E) Graphical illustration of the average aggregate size measured at the indicated day of cultivation: Day 8, shNC n = 116, sh-GMNN n = 108; Day 16, shNC n = 130, sh-GMNN n = 161. Images were analyzed using Nikon NIS Elements D software, mean ± SD, Student’s unpaired t-test, ***p < 0.001. (F) The protein–protein associations about geminin protein. Data from STRING. (G) ROS analysis of A2780 cells under geminin depletion. The percentage of apoptosis cells was analyzed with flow cytometry. Mean ± SEM, n = 3, Student’s unpaired t-test, ***p < 0.001. (H) IB analysis of LC3B protein levels in A2780 cells as indicated. Mean ± SEM, n = 3, Student’s unpaired t-test, ***p < 0.001.

8). Mitochonic Acid-5 Inhibits Reactive Oxygen Species Production and Improves Human Chondrocyte Survival by Upregulating SIRT3-Mediated, Parkin-dependent Mitophagy. Frontiers in Pharmacology (PubMed: 35734404) [IF=5.6]

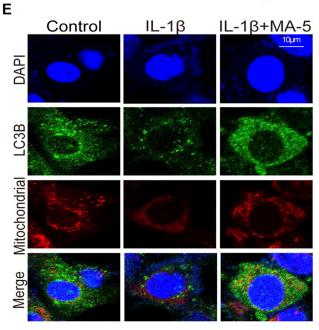
Application: IF/ICC    Species: Human    Sample: OA cells

FIGURE 4 MA-5 promotes SIRT3 expression and activates Parkin-dependent mitophagy. (A–C) SIRT3 and Parkin levels in OA cells were detected using western blotting. (D) Difference in Parkin fluorescent signal in mitochondria were assessed using confocal microscopy. (E) Differences in LC3B expression among different treatment groups were detected via immunofluorescence. (F–K) Cell apoptosis, ROS, and membrane potential were detected via flow cytometry. All data are presented as mean ± standard deviation. ***p < 0.001, **p < 0.01, and *p < 0.05 represent differences between groups, as determined using a one-way analysis of variance.(a), (b).

9). Neuroprotective Effects of Oxymatrine via Triggering Autophagy and Inhibiting Apoptosis Following Spinal Cord Injury in Rats. MOLECULAR NEUROBIOLOGY (PubMed: 37115405) [IF=5.1]

10). GLP-1 Alleviates Diabetic Kidney Disease Through Activation of Autophagy by Regulating AMPK/mTOR Pathway. AMERICAN JOURNAL OF PHYSIOLOGY-ENDOCRINOLOGY AND METABOLISM (PubMed: 32985256) [IF=5.1]

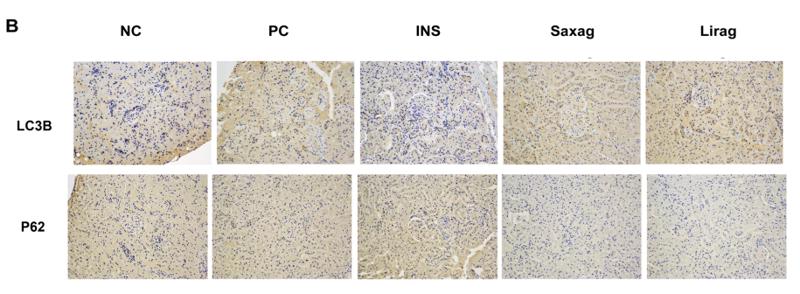
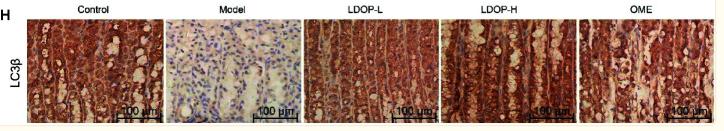
Application: IHC    Species: Rat    Sample: kidney cell

Figure 3. Liraglutide promoted autophagy via mTOR signaling pathways (A) Western blot was used to detect the expression of p-P70S6K, S6K, P70S6 and S6 in indicated renal tissues. (B) Immunohistochemistry of LC3 and P62 expression were assessed in rats’ kidney Downloaded from journals.physiology.org/journal/ajpendo at Univ Col London (193.060.238.225) on October 1, 2020. 29 cells samples. (C) mRNA level of mTOR and Beclin-1 was assessed using Real time PCR. The 561 levels of free radical scavenger, including SOD and GSH in blood serum’s samples of all groups were measured utilizing the Elisa kits. (D) Autophagy markers, including LC3B, P62 and Beclin-1 in indicated renal tissues were detected using western blot. NC: non-diabetic control group, n = 7; PC: diabetic control group, n = 7; INS: insulin treated group, n = 7; Saxag: saxagliptin treated group, n = 7; Lirag: liraglutide treated group, n = 9. The data are expressed as the means ± SD. vs the NC group, &P<0.05, &&P<0.01; vs the PC group, *P<0.05, **P<0.01; vs the 567 Lirag group, #P<0.05, ##P<0.01.

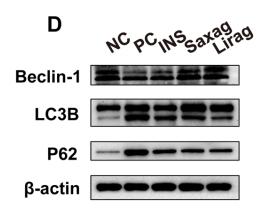
Application: WB    Species: Rat    Sample: renal tissues

Figure 3. Liraglutide promoted autophagy via mTOR signaling pathways (A) Western blot was used to detect the expression of p-P70S6K, S6K, P70S6 and S6 in indicated renal tissues. (B) Immunohistochemistry of LC3 and P62 expression were assessed in rats’ kidney Downloaded from journals.physiology.org/journal/ajpendo at Univ Col London (193.060.238.225) on October 1, 2020. 29 cells samples. (C) mRNA level of mTOR and Beclin-1 was assessed using Real time PCR. The 561 levels of free radical scavenger, including SOD and GSH in blood serum’s samples of all groups were measured utilizing the Elisa kits. (D) Autophagy markers, including LC3B, P62 and Beclin-1 in indicated renal tissues were detected using western blot. NC: non-diabetic control group, n = 7; PC: diabetic control group, n = 7; INS: insulin treated group, n = 7; Saxag: saxagliptin treated group, n = 7; Lirag: liraglutide treated group, n = 9. The data are expressed as the means ± SD. vs the NC group, &P<0.05, &&P<0.01; vs the PC group, *P<0.05, **P<0.01; vs the 567 Lirag group, #P<0.05, ##P<0.01.

加载更多

限制条款

产品的规格、报价、验证数据请以官网为准,官网链接:www.affbiotech.com | www.affbiotech.cn(简体中文)| www.affbiotech.jp(日本語)

产品的数据信息为Affinity所有,未经授权不得收集Affinity官网数据或资料用于商业用途,对抄袭产品数据的行为我们将保留诉诸法律的权利。

产品相关数据会因产品批次、产品检测情况随时调整,如您已订购该产品,请以订购时随货说明书为准,否则请以官网内容为准,官网内容有改动时恕不另行通知。

Affinity保证所销售产品均经过严格质量检测。如您购买的商品在规定时间内出现问题需要售后时,请您在Affinity官方渠道提交售后申请。

产品仅供科学研究使用。不用于诊断和治疗。 

产品未经授权不得转售。

Affinity Biosciences将不会对在使用我们的产品时可能发生的专利侵权或其他侵权行为负责。Affinity Biosciences, Affinity Biosciences标志和所有其他商标所有权归Affinity Biosciences LTD.