alpha SMA Antibody - #BF9212

产品描述
*The optimal dilutions should be determined by the end user.
*Tips:
WB: 适用于变性蛋白样本的免疫印迹检测. IHC: 适用于组织样本的石蜡(IHC-p)或冰冻(IHC-f)切片样本的免疫组化/荧光检测. IF/ICC: 适用于细胞样本的荧光检测. ELISA(peptide): 适用于抗原肽的ELISA检测.
引用格式: Affinity Biosciences Cat# BF9212, RRID:AB_2839428.
展开/折叠
a actin; AAT6; ACTA_HUMAN; ACTA2; Actin alpha 2 smooth muscle aorta; Actin aortic smooth muscle; Actin; aortic smooth muscle; ACTSA; ACTVS; Alpha 2 actin; Alpha actin 2; Alpha cardiac actin; Alpha-actin-2; Cell growth inhibiting gene 46 protein; Cell growth-inhibiting gene 46 protein; GIG46; Growth inhibiting gene 46; MYMY5; Sarcomeric Actin;
抗原和靶标
A Mouse monoclonal antibody is prepared by immunizing recombinant protein.
- P62736 ACTA_HUMAN:
- Protein BLAST With
- NCBI/
- ExPASy/
- Uniprot
MCEEEDSTALVCDNGSGLCKAGFAGDDAPRAVFPSIVGRPRHQGVMVGMGQKDSYVGDEAQSKRGILTLKYPIEHGIITNWDDMEKIWHHSFYNELRVAPEEHPTLLTEAPLNPKANREKMTQIMFETFNVPAMYVAIQAVLSLYASGRTTGIVLDSGDGVTHNVPIYEGYALPHAIMRLDLAGRDLTDYLMKILTERGYSFVTTAEREIVRDIKEKLCYVALDFENEMATAASSSSLEKSYELPDGQVITIGNERFRCPETLFQPSFIGMESAGIHETTYNSIMKCDIDIRKDLYANNVLSGGTTMYPGIADRMQKEITALAPSTMKIKIIAPPERKYSVWIGGSILASLSTFQQMWISKQEYDEAGPSIVHRKCF
翻译修饰 - P62736 作为底物
| Site | PTM Type | Enzyme | Source |
|---|---|---|---|
| E3 | Acetylation | Uniprot | |
| S35 | Phosphorylation | Uniprot | |
| K52 | Acetylation | Uniprot | |
| K52 | Methylation | Uniprot | |
| K52 | Ubiquitination | Uniprot | |
| S54 | Phosphorylation | Uniprot | |
| Y55 | Phosphorylation | Uniprot | |
| S62 | Phosphorylation | Uniprot | |
| K63 | Acetylation | Uniprot | |
| K63 | Sumoylation | Uniprot | |
| K63 | Ubiquitination | Uniprot | |
| T68 | Phosphorylation | Uniprot | |
| K70 | Acetylation | Uniprot | |
| K70 | Methylation | Uniprot | |
| K70 | Ubiquitination | Uniprot | |
| Y71 | Phosphorylation | Uniprot | |
| T79 | Phosphorylation | Uniprot | |
| K86 | Acetylation | Uniprot | |
| K86 | Methylation | Uniprot | |
| S91 | Phosphorylation | Uniprot | |
| Y93 | Phosphorylation | Uniprot | |
| R97 | Methylation | Uniprot | |
| K115 | Acetylation | Uniprot | |
| K115 | Ubiquitination | Uniprot | |
| T128 | Phosphorylation | Uniprot | |
| Y145 | Phosphorylation | Uniprot | |
| T151 | Phosphorylation | Uniprot | |
| S157 | Phosphorylation | Uniprot | |
| Y168 | Phosphorylation | Uniprot | |
| Y171 | Phosphorylation | Uniprot | |
| T188 | Phosphorylation | Uniprot | |
| Y190 | Phosphorylation | Uniprot | |
| K193 | Acetylation | Uniprot | |
| K193 | Methylation | Uniprot | |
| K193 | Ubiquitination | Uniprot | |
| T196 | Phosphorylation | Uniprot | |
| R198 | Methylation | Uniprot | |
| Y200 | Phosphorylation | Uniprot | |
| S201 | Phosphorylation | Uniprot | |
| T204 | Phosphorylation | Uniprot | |
| K215 | Acetylation | Uniprot | |
| K215 | Ubiquitination | Uniprot | |
| K217 | Acetylation | Uniprot | |
| K217 | Methylation | Uniprot | |
| C219 | S-Nitrosylation | Uniprot | |
| Y220 | Phosphorylation | Uniprot | |
| S235 | Phosphorylation | Uniprot | |
| S236 | Phosphorylation | Uniprot | |
| S237 | Phosphorylation | Uniprot | |
| K240 | Ubiquitination | Uniprot | |
| S241 | Phosphorylation | Uniprot | |
| Y242 | Phosphorylation | Uniprot | |
| T251 | Phosphorylation | Uniprot | |
| C259 | S-Nitrosylation | Uniprot | |
| T262 | Phosphorylation | Uniprot | |
| S267 | Phosphorylation | Uniprot | |
| T280 | Phosphorylation | Uniprot | |
| Y281 | Phosphorylation | Uniprot | |
| S283 | Phosphorylation | Uniprot | |
| C287 | S-Nitrosylation | Uniprot | |
| K293 | Ubiquitination | Uniprot | |
| Y296 | Phosphorylation | Uniprot | |
| T305 | Phosphorylation | Uniprot | |
| T306 | Phosphorylation | Uniprot | |
| Y308 | Phosphorylation | Uniprot | |
| K317 | Acetylation | Uniprot | |
| K317 | Sumoylation | Uniprot | |
| K317 | Ubiquitination | Uniprot | |
| T320 | Phosphorylation | Uniprot | |
| S325 | Phosphorylation | Uniprot | |
| T326 | Phosphorylation | Uniprot | |
| K328 | Acetylation | Uniprot | |
| K328 | Methylation | Uniprot | |
| K328 | Sumoylation | Uniprot | |
| K328 | Ubiquitination | Uniprot | |
| K330 | Acetylation | Uniprot | |
| K330 | Sumoylation | Uniprot | |
| K330 | Ubiquitination | Uniprot | |
| K338 | Sumoylation | Uniprot | |
| S350 | Phosphorylation | Uniprot | |
| Y364 | Phosphorylation | Uniprot | |
| S370 | Phosphorylation | Uniprot | |
| K375 | Ubiquitination | Uniprot | |
| C376 | S-Nitrosylation | Uniprot |
研究背景
Actins are highly conserved proteins that are involved in various types of cell motility and are ubiquitously expressed in all eukaryotic cells.
Oxidation of Met-46 and Met-49 by MICALs (MICAL1, MICAL2 or MICAL3) to form methionine sulfoxide promotes actin filament depolymerization. MICAL1 and MICAL2 produce the (R)-S-oxide form. The (R)-S-oxide form is reverted by MSRB1 and MSRB2, which promotes actin repolymerization.
Monomethylation at Lys-86 (K84me1) regulates actin-myosin interaction and actomyosin-dependent processes. Demethylation by ALKBH4 is required for maintaining actomyosin dynamics supporting normal cleavage furrow ingression during cytokinesis and cell migration.
Methylated at His-75 by SETD3.
(Microbial infection) Monomeric actin is cross-linked by V.cholerae toxins RtxA and VgrG1 in case of infection: bacterial toxins mediate the cross-link between Lys-52 of one monomer and Glu-272 of another actin monomer, resulting in formation of highly toxic actin oligomers that cause cell rounding. The toxin can be highly efficient at very low concentrations by acting on formin homology family proteins: toxic actin oligomers bind with high affinity to formins and adversely affect both nucleation and elongation abilities of formins, causing their potent inhibition in both profilin-dependent and independent manners.
Cytoplasm>Cytoskeleton.
Polymerization of globular actin (G-actin) leads to a structural filament (F-actin) in the form of a two-stranded helix. Each actin can bind to 4 others.
Belongs to the actin family.
研究领域
· Environmental Information Processing > Signal transduction > Apelin signaling pathway. (View pathway)
· Organismal Systems > Circulatory system > Vascular smooth muscle contraction. (View pathway)
· Organismal Systems > Endocrine system > Relaxin signaling pathway.
文献引用
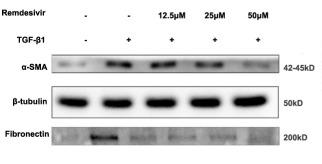
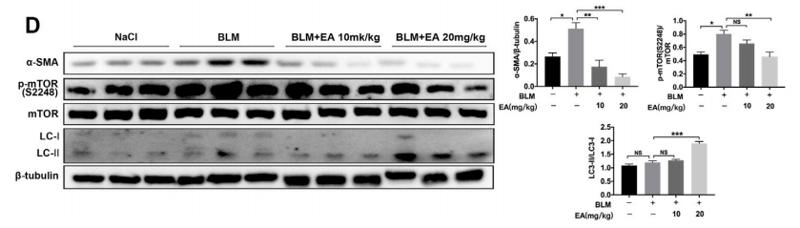
Application: WB Species: Mice Sample: lung tissues

Application: WB Species: Mouse Sample: MLE-12 cells
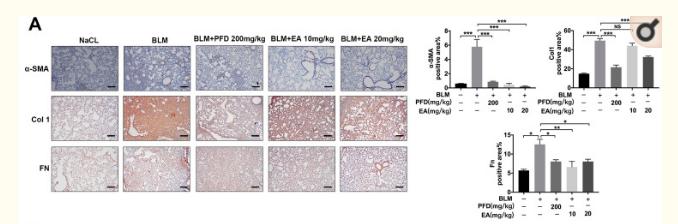
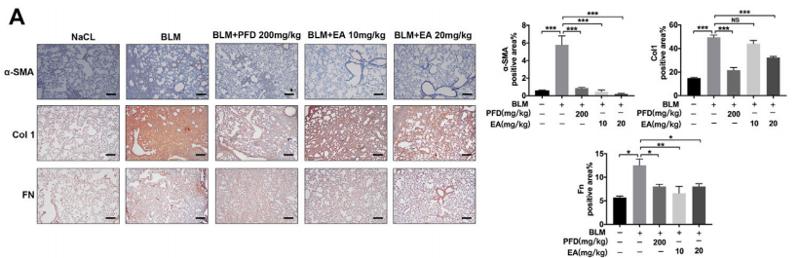
Application: IHC Species: mice Sample: lung tissue

Application: WB Species: mice Sample: lung tissue
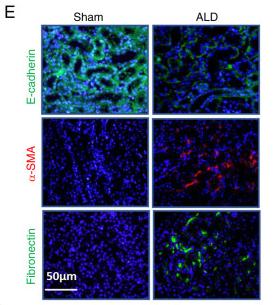
Application: IHC Species: mouse Sample: Lung
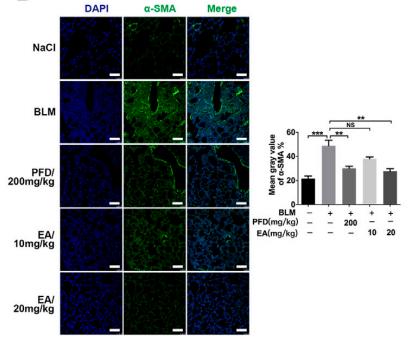
Application: IF/ICC Species: mouse Sample: Lung
Application: WB Species: mouse Sample: Lung
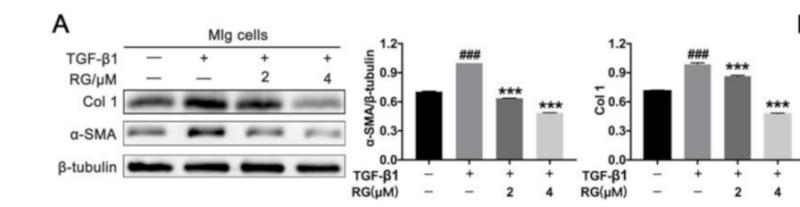
Application: WB Species: Mouse Sample: Mouse lung fibroblast (Mlg) or NaCl-primary pulmonary fibroblast (PPF) cells
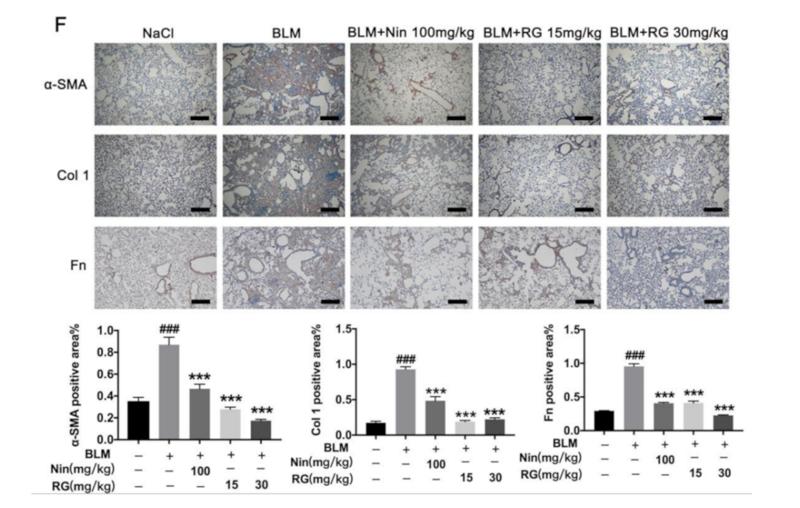
Application: IHC Species: mice Sample: lung tissue

Application: WB Species: Mice Sample: kidneys
Application: IF/ICC Species: Mice Sample: kidneys
Application: WB Species: Human Sample: MRC-5 cells

Application: IF/ICC Species: Human Sample: MRC-5 cells
限制条款
产品的规格、报价、验证数据请以官网为准,官网链接:www.affbiotech.com | www.affbiotech.cn(简体中文)| www.affbiotech.jp(日本語)产品的数据信息为Affinity所有,未经授权不得收集Affinity官网数据或资料用于商业用途,对抄袭产品数据的行为我们将保留诉诸法律的权利。
产品相关数据会因产品批次、产品检测情况随时调整,如您已订购该产品,请以订购时随货说明书为准,否则请以官网内容为准,官网内容有改动时恕不另行通知。
Affinity保证所销售产品均经过严格质量检测。如您购买的商品在规定时间内出现问题需要售后时,请您在Affinity官方渠道提交售后申请。产品仅供科学研究使用。不用于诊断和治疗。
产品未经授权不得转售。
Affinity Biosciences将不会对在使用我们的产品时可能发生的专利侵权或其他侵权行为负责。Affinity Biosciences, Affinity Biosciences标志和所有其他商标所有权归Affinity Biosciences LTD.