产品: 磷酸化 MFF (Ser172/Ser146) 抗体
货号: AF2365
描述: Rabbit polyclonal antibody to Phospho-MFF (Ser172/Ser146)
应用: WB IHC
文献验证: WB
反应: Human
预测: Rabbit
分子量: 25, 27kDa; 38kD(Calculated).
蛋白号: Q9GZY8
RRID: AB_2845379

浏览相似产品>>

   规格 价格 库存
 100ul RMB¥ 2800 现货
 200ul RMB¥ 3800 现货

货期: 当天发货

联系销售

产品描述

来源:
Rabbit
应用:
WB 1:500-1:2000, IHC 1:50-1:200
*The optimal dilutions should be determined by the end user.
*Tips:

WB: 适用于变性蛋白样本的免疫印迹检测. IHC: 适用于组织样本的石蜡(IHC-p)或冰冻(IHC-f)切片样本的免疫组化/荧光检测. IF/ICC: 适用于细胞样本的荧光检测. ELISA(peptide): 适用于抗原肽的ELISA检测.

反应:
Human
预测:
Rabbit(86%)
克隆:
Polyclonal
特异性:
Phospho-MFF (Ser172/Ser146) Antibody detects endogenous levels of MFF only when phosphorylated at Ser172/146.
RRID:
AB_2845379
引用格式: Affinity Biosciences Cat# AF2365, RRID:AB_2845379.
偶联:
Unconjugated.
纯化:
The antibody is from purified rabbit serum by affinity purification via sequential chromatography on phospho-peptide and non-phospho-peptide affinity columns.
保存:
Rabbit IgG in phosphate buffered saline , pH 7.4, 150mM NaCl, 0.02% sodium azide and 50% glycerol. Store at -20 °C. Stable for 12 months from date of receipt.
别名:

展开/折叠

C2orf33; Chromosome 2 open reading frame 33; DKFZp666J168; GL004; Mff; MFF_HUMAN; MGC110913; Mitochondrial fission factor; OTTHUMP00000164235;

抗原和靶标

免疫原:

A synthesized peptide derived from human MFF around the phosphorylation site of Ser172.

Uniprot:
基因/基因ID:
表达:
Q9GZY8 MFF_HUMAN:

Highly expressed in heart, kidney, liver, brain, muscle, and stomach.

序列:
MSKGTSSDTSLGRVSRAAFPSPTAAEMAEISRIQYEMEYTEGISQRMRVPEKLKVAPPNADLEQGFQEGVPNASVIMQVPERIVVAGNNEDVSFSRPADLDLIQSTPFKPLALKTPPRVLTLSERPLDFLDLERPPTTPQNEEIRAVGRLKRERSMSENAVRQNGQLVRNDSLWHRSDSAPRNKISRFQAPISAPEYTVTPSPQQARVCPPHMLPEDGANLSSARGILSLIQSSTRRAYQQILDVLDENRRPVLRGGSAAATSNPHHDNVRYGISNIDTTIEGTSDDLTVVDAASLRRQIIKLNRRLQLLEEENKERAKREMVMYSITVAFWLLNSWLWFRR

种属预测

种属预测:

score>80的预测可信度较高,可尝试用于WB检测。*预测模型主要基于免疫原序列比对,结果仅作参考,不作为质保凭据。

Species
Results
Score
Rabbit
86
Sheep
75
Horse
71
Xenopus
71
Chicken
71
Pig
50
Bovine
0
Dog
0
Zebrafish
0
Model Confidence:
High(score>80) Medium(80>score>50) Low(score<50) No confidence

研究背景

功能:

Plays a role in mitochondrial and peroxisomal fission. Promotes the recruitment and association of the fission mediator dynamin-related protein 1 (DNM1L) to the mitochondrial surface. May be involved in regulation of synaptic vesicle membrane dynamics by recruitment of DNM1L to clathrin-containing vesicles.

细胞定位:

Mitochondrion outer membrane>Single-pass type IV membrane protein. Peroxisome. Cytoplasmic vesicle>Secretory vesicle>Synaptic vesicle.

Extracellular region or secreted Cytosol Plasma membrane Cytoskeleton Lysosome Endosome Peroxisome ER Golgi apparatus Nucleus Mitochondrion Manual annotation Automatic computational assertionSubcellular location
组织特异性:

Highly expressed in heart, kidney, liver, brain, muscle, and stomach.

蛋白家族:

Belongs to the Tango11 family.

文献引用

1). AMPK is a mechano-metabolic sensor linking cell adhesion and mitochondrial dynamics to Myosin-dependent cell migration. Nature Communications, 2023 (PubMed: 37217519) [IF=16.6]

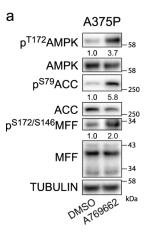
Application: WB    Species: Human    Sample: A375P cells

Fig. 5: Mitochondrial dynamics in 3D migration. a Upon AMPK activation (A769662 10 μM, 30 min) in A375P cells, western blot of the indicated proteins (n = 3). b (Left) Representative images of mitochondrial network (Tom20, green), F-actin (red) and nucleus (Hoechst, blue) after A769662 treatment (10 μM, 24 h). Scale bar = 5 μm. (Right) Quantification of mitochondrial branches per cell from Tom20 staining (10, 17 cells pooled from n = 3). c Western blot of the indicated proteins after AMPK knock-down in A375M2 cells (n = 3). d (Left) Representative images of mitochondrial network (Tom20 (green), F-actin (red) and nucleus (Hoechst, blue)) after AMPK knock-down. Scale bar = 5 μm. (Right) Quantification of mitochondrial branches per cell from Tom20 staining (14, 13 cells pooled from n = 3). e Live cell imaging of mitochondria using MitoTracker Deep Red of the indicated cell lines stably transfected with LifeAct-GFP. Bottom panel show MitoTracker Deep Red segmentation used for quantification. Scale bar = 10 μm. Quantification of mitochondrial branches per cell from Tom20 staining (12, 20, 14, 30 cells pooled from n = 3). f Representative images of TMRE (red) and mitoTracker Green (green). Quantification of TMRE fluorescence intensity per cell (15 cells pooled from n = 3). g (Left) Representative images of mitochondrial network (Tom20, green), F-actin (red) and nucleus (Hoechst, blue) after DDR1 knock-down and Comp C treatment (2 μM, 24 h). Scale bar = 5 μm. (Right) Quantification of mitochondrial branches per cell from Tom20 staining (11, 10, 20, 10 cells pooled from n = 3). Western blot quantifications normalized by each total protein (a, c). Cells seeded on a collagen I matrix (b, d, e, f, g). Dot plots (b, d, e, f, g) show median with interquartile range (each dot represents a single cell). p values were calculated using two-tailed tests (b, d–f). p value by unpaired t-test (b, d, e, f) and Kruskal–Wallis with Dunn’s multiple comparisons test (g). All n are indicative of independent experiments unless otherwise stated. Source data are provided as a Source Data file.

2). High-fat diet-induced L-saccharopine accumulation inhibits estradiol synthesis and damages oocyte quality by disturbing mitochondrial homeostasis. Gut microbes, 2024 (PubMed: 39410876) [IF=12.2]

Application: WB    Species: Mouse    Sample:

Figure 7. HFD and HFD-fMT induced abnormalities in ovarian mitochondrial morphology and function. a-f, Transmision electronmicroscopy (TEM) images showing morphological changes in mitochondria in the ovaries of mice, as well as the number andproportion of abnormal mitochondria (n = 5). Scale bars, 2 um and 500 nm. Red stars indicate markedly abnormal mitochondria. g, hFold-change of ATP production in the ovaries of mice (n = 3),i, Expression of proteins critical for mitochondrial fusion and fssion in theovaries of mice by western blotting (n = 3).lindividual values are displayed as dots, while mean + SEM is shown as a column and errorbar. Statistical signifcance was determined using a two-tailed unpared Student's t-test. p

3). Microcystin-leucine-arginine induced neurotoxicity by initiating mitochondrial fission in hippocampal neurons. Science of The Total Environment, 2020 (PubMed: 31753492) [IF=8.2]

4). Caffeine promotes angiogenesis through modulating endothelial mitochondrial dynamics. Acta Pharmacologica Sinica, 2021 (PubMed: 33664417) [IF=6.9]

Application: WB    Species: Mouse    Sample:

Fig. 6 The cAMP/PKA/AMPK signaling pathway contributes to caffeine-induced mitochondrial fission and mitochondrial distribution to lamellipodia region. HUVECs were incubated with vehicle or caffeine (50 μM) in the presence or absence of H89 (10 μM) or compound C (5 μM) for the indicated durations. a, b Representative mitochondria from HUVECs cultured for 6 h (n = 3). Scale bar, 25 μm. c–e Representative images and quantification of the lamellipodia extent (d; n = 10) and relative fluorescent intensity of mitochondria in the lamellipodia region (e; n = 5) in HUVECs cultured for 12 h. Scale bar, 25 μm. f, g Western blot analysis of p-MFF protein levels in HUVECs incubated with vehicle or caffeine (50 μM) in the presence of 8-Br-cAMP (200 μM), H89 (10 μM), or compound C (5 μM) for 2 h (n = 3). *P 

5). Mitochondrial Biology in Health, Aging, and Disease: PTPMT1 protects cardiomyocytes from necroptosis induced by γ-ray irradiation through alleviating mitochondria injury. American Journal of Physiology - Cell Physiology, 2023 (PubMed: 37154493) [IF=5.0]

6). PTPMT1 protects cardiomyocytes from necroptosis induced by γ-ray irradiation through alleviating mitochondria injury. American Journal of Physiology-Cell Physiology, 2021 (PubMed: 37154493) [IF=5.0]

Application: WB    Species: Rat    Sample:

Figure 3. Effects of γ-ray irradiation on AMPK, DRP1 and MFF signaling and changes in PTPMT1 expression in iPSC-CMs. qPCR (A) and Western blotting (B) were used to determine the expression of AMPK, and the histogram shows the quantitative results of B (C). Western blotting was used to determine the expression of fission-related proteins (p-DRP-1 and p-MFF; D), and the quantitative results are shown (E). qPCR (F) and Western blotting (G) were used to determine the gene expression level of PTPMT1, and the quantitative results of G are shown (H). Data are expressed as the means ± SE, n = 3 (replicates). One-way ANOVA was used for statistical analysis. *P < 0.05, **P < 0.01, ***P < 0.001, ****P < 0.0001, vs. 0 Gy group; ##P < 0.01, ###P < 0.001, ####P < 0.0001, vs. 10 Gy group. iPSC-CMs, induced pluripotent stem cell-derived cardiomyocytes; p-DRP1, phosphorylated-dynamin-related protein 1; p-MFF, phosphorylated-mitochondrial fission factor; PTPMT1, protein tyrosine phosphatase, mitochondrial 1.

7). Calcium signals tune AMPK activity and mitochondrial homeostasis in dendrites of developing neurons. Development (Cambridge, England), 2023 (PubMed: 37823352) [IF=3.7]

Application: WB    Species: Mouse    Sample:

Fig. 6. MFF is activated by AMPK and regulates mitochondrial fission and mitophagy in dendrites during dendritic outgrowth. (A,B) Phosphorylation of AMPKα and its downstream effectors in neurons treated with either TTX+APV (6 h), 100 µM glutamate (5 and 10 min) or 2 mM AICAR (30 min and 1 h) at DIV5. Blots were probed with antibodies against total and p-Thr172 AMPKα, total and p-Ser146 MFF, total and p-Ser555 ULK1, and β-actin. (C,D) Relative amount of phosphorylated forms to total proteins of AMPKα, MFF and ULK1. Samples were taken from four to six independent experiments. **P

8). Blocking exosomal secretion aggravates 1, 4‐Benzoquinone‐induced mitochondrial fission activated by the AMPK/MFF/Drp1 pathway in HL‐60 cells. JOURNAL OF APPLIED TOXICOLOGY, 2022 (PubMed: 35383983) [IF=2.7]

9). 海馬ニューロンの樹状突起形成におけるミトコンドリア動態制御機構. , 2024

10). M1 Microglia Induced Neuronal Injury on Ischemic Stroke via Mitochondrial Crosstalk between Microglia and Neurons. Oxidative Medicine and Cellular Longevity, 2022 (PubMed: 36478988)

Application: WB    Species: Mouse    Sample: M0-BV2 and M1-BV2 cells

Figure 3 Mitochondrial changes in activated microglia (M1). (a) Schematic diagram of intracellular mitochondrial fusion and fission process in microglia after OGD/R. (b) Western blot assay of mitochondrial fusion protein (Opa1 and Mfn1), TOM20, and cytochrome c in mitochondria of M0 and M1 microglia (n = 3). Results are displayed in a form of mean ± SD; ∗P < 0.05, ∗∗P < 0.01, and ∗∗∗P < 0.001. (c) Western blotting findings of mitochondrial fission protein including MFF, Fis1, Mid49, and Mid51 in mitochondria of M0 and M1 microglia (n = 3). Data presented are mean ± SD; ∗∗P < 0.01 and ∗∗∗P < 0.001. (d) Mitochondrial function in M1 microglia and M0 microglia was investigated by determining ATP (n = 3), mitochondria membrane potential (n = 3), and ROS (n = 3). The relative ratio of intracellular ATP was determined by calculating the ratio of level of ATP in M0-BV2 and M1-BV2 cells to level of ATP in M0-BV2 cells. Results are displayed in a form of mean ± SD. ∗∗P < 0.01 and ∗∗∗P < 0.001. (e) Morphology of intracellular mitochondria in BV2 cells visualized under TEM, scale bar: 1.0 μm.

加载更多

限制条款

产品的规格、报价、验证数据请以官网为准,官网链接:www.affbiotech.com | www.affbiotech.cn(简体中文)| www.affbiotech.jp(日本語)

产品的数据信息为Affinity所有,未经授权不得收集Affinity官网数据或资料用于商业用途,对抄袭产品数据的行为我们将保留诉诸法律的权利。

产品相关数据会因产品批次、产品检测情况随时调整,如您已订购该产品,请以订购时随货说明书为准,否则请以官网内容为准,官网内容有改动时恕不另行通知。

Affinity保证所销售产品均经过严格质量检测。如您购买的商品在规定时间内出现问题需要售后时,请您在Affinity官方渠道提交售后申请。

产品仅供科学研究使用。不用于诊断和治疗。 

产品未经授权不得转售。

Affinity Biosciences将不会对在使用我们的产品时可能发生的专利侵权或其他侵权行为负责。Affinity Biosciences, Affinity Biosciences标志和所有其他商标所有权归Affinity Biosciences LTD.