产品: 磷酸化 MYPT1 (Ser472) 抗体
货号: AF3779
描述: Rabbit polyclonal antibody to Phospho-MYPT1 (Ser472)
应用: WB
反应: Human, Mouse, Rat
分子量: 115kD(Calculated).
蛋白号: O14974
RRID: AB_2847093

浏览相似产品>>

   规格 价格 库存
 100ul RMB¥ 2800 现货
 200ul RMB¥ 3800 现货

货期: 当天发货

联系销售

产品描述

来源:
Rabbit
应用:
WB 1:500-1:2000
*The optimal dilutions should be determined by the end user.
*Tips:

WB: 适用于变性蛋白样本的免疫印迹检测. IHC: 适用于组织样本的石蜡(IHC-p)或冰冻(IHC-f)切片样本的免疫组化/荧光检测. IF/ICC: 适用于细胞样本的荧光检测. ELISA(peptide): 适用于抗原肽的ELISA检测.

反应:
Human,Mouse,Rat
克隆:
Polyclonal
特异性:
Phospho-MYPT1 (Ser472) Antibody detects endogenous levels of MYPT1 only when phosphorylated at Ser472.
RRID:
AB_2847093
引用格式: Affinity Biosciences Cat# AF3779, RRID:AB_2847093.
偶联:
Unconjugated.
纯化:
The antibody is from purified rabbit serum by affinity purification via sequential chromatography on phospho-peptide and non-phospho-peptide affinity columns.
保存:
Rabbit IgG in phosphate buffered saline , pH 7.4, 150mM NaCl, 0.02% sodium azide and 50% glycerol. Store at -20 °C. Stable for 12 months from date of receipt.
别名:

展开/折叠

M130; MBS; Myosin binding subunit; Myosin phosphatase target subunit 1; Myosin phosphatase targeting subunit 1; Myosin phosphatase-targeting subunit 1; MYPT1; MYPT1_HUMAN; PPP1R12A; Protein phosphatase 1 regulatory inhibitor subunit 12A; Protein phosphatase 1 regulatory subunit 12A; Protein phosphatase 1, regulatory (inhibitor) subunit 12A; Protein phosphatase myosin binding subunit; Protein phosphatase myosin-binding subunit;

抗原和靶标

免疫原:

A synthesized peptide derived from human MYPT1 around the phosphorylation site of Ser472.

Uniprot:
基因/基因ID:
表达:
O14974 MYPT1_HUMAN:

Expressed in striated muscles, specifically in type 2a fibers (at protein level).

序列:
MKMADAKQKRNEQLKRWIGSETDLEPPVVKRQKTKVKFDDGAVFLAACSSGDTDEVLKLLHRGADINYANVDGLTALHQACIDDNVDMVKFLVENGANINQPDNEGWIPLHAAASCGYLDIAEFLIGQGAHVGAVNSEGDTPLDIAEEEAMEELLQNEVNRQGVDIEAARKEEERIMLRDARQWLNSGHINDVRHAKSGGTALHVAAAKGYTEVLKLLIQAGYDVNIKDYDGWTPLHAAAHWGKEEACRILVDNLCDMEMVNKVGQTAFDVADEDILGYLEELQKKQNLLHSEKRDKKSPLIESTANMDNNQSQKTFKNKETLIIEPEKNASRIESLEQEKVDEEEEGKKDESSCSSEEDEEDDSESEAETDKTKPLASVTNANTSSTQAAPVAVTTPTVSSGQATPTSPIKKFPTTATKISPKEEERKDESPATWRLGLRKTGSYGALAEITASKEGQKEKDTAGVTRSASSPRLSSSLDNKEKEKDSKGTRLAYVAPTIPRRLASTSDIEEKENRDSSSLRTSSSYTRRKWEDDLKKNSSVNEGSTYHKSCSFGRRQDDLISSSVPSTTSTPTVTSAAGLQKSLLSSTSTTTKITTGSSSAGTQSSTSNRLWAEDSTEKEKDSVPTAVTIPVAPTVVNAAASTTTLTTTTAGTVSSTTEVRERRRSYLTPVRDEESESQRKARSRQARQSRRSTQGVTLTDLQEAEKTIGRSRSTRTREQENEEKEKEEKEKQDKEKQEEKKESETSREDEYKQKYSRTYDETYQRYRPVSTSSSTTPSSSLSTMSSSLYASSQLNRPNSLVGITSAYSRGITKENEREGEKREEEKEGEDKSQPKSIRERRRPREKRRSTGVSFWTQDSDENEQEQQSDTEEGSNKKETQTDSISRYETSSTSAGDRYDSLLGRSGSYSYLEERKPYSSRLEKDDSTDFKKLYEQILAENEKLKAQLHDTNMELTDLKLQLEKATQRQERFADRSLLEMEKRERRALERRISEMEEELKMLPDLKADNQRLKDENGALIRVISKLSK

翻译修饰 - O14974 作为底物

Site PTM Type Enzyme
K9 Acetylation
S20 Phosphorylation
T22 Phosphorylation
T34 Phosphorylation
Y68 Phosphorylation
T234 Phosphorylation
K244 Ubiquitination
K285 Ubiquitination
K286 Ubiquitination
S292 Phosphorylation
S299 Phosphorylation
S304 Phosphorylation
S313 Phosphorylation
S336 Phosphorylation
S365 Phosphorylation
T406 Phosphorylation
T408 Phosphorylation
S409 Phosphorylation
T416 Phosphorylation
T417 Phosphorylation
T419 Phosphorylation
S422 Phosphorylation
S432 Phosphorylation P06493 (CDK1)
K442 Acetylation
T443 Phosphorylation O75116 (ROCK2)
S445 Phosphorylation O60285 (NUAK1) , O95835 (LATS1)
Y446 Phosphorylation
T453 Phosphorylation
K456 Acetylation
K460 Acetylation
T464 Phosphorylation
S470 Phosphorylation
S472 Phosphorylation O60285 (NUAK1)
S473 Phosphorylation P06493 (CDK1)
S477 Phosphorylation
S478 Phosphorylation
S479 Phosphorylation
S489 Phosphorylation
Y496 Phosphorylation
T500 Phosphorylation
S507 Phosphorylation
T508 Phosphorylation
S509 Phosphorylation
S520 Phosphorylation
S525 Phosphorylation
T529 Phosphorylation
K539 Methylation
S541 Phosphorylation
S542 Phosphorylation
S547 Phosphorylation
T548 Phosphorylation
Y549 Phosphorylation
K551 Methylation
S552 Phosphorylation
S554 Phosphorylation
T571 Phosphorylation
T575 Phosphorylation
S578 Phosphorylation
S585 Phosphorylation
S601 Phosphorylation P06493 (CDK1)
S607 Phosphorylation
S608 Phosphorylation
T609 Phosphorylation
S618 Phosphorylation
T631 Phosphorylation
T645 Phosphorylation
T647 Phosphorylation
T652 Phosphorylation
S668 Phosphorylation
Y669 Phosphorylation
T671 Phosphorylation
S678 Phosphorylation
S680 Phosphorylation
S692 Phosphorylation Q13976 (PRKG1)
S695 Phosphorylation P17612 (PRKACA) , Q13976 (PRKG1)
T696 Phosphorylation Q09013 (DMPK) , P04049 (RAF1) , Q13464 (ROCK1) , P17612 (PRKACA) , O75116 (ROCK2) , Q13418 (ILK)
T700 Phosphorylation
T702 Phosphorylation
T710 Phosphorylation Q13418 (ILK)
S716 Phosphorylation
T717 Phosphorylation
T719 Phosphorylation
K743 Acetylation
T748 Phosphorylation
S749 Phosphorylation
Y754 Phosphorylation
K755 Acetylation
Y758 Phosphorylation
S759 Phosphorylation
T761 Phosphorylation
Y762 Phosphorylation
T765 Phosphorylation
Y766 Phosphorylation
Y769 Phosphorylation
S781 Phosphorylation
S790 Phosphorylation
Y792 Phosphorylation
S794 Phosphorylation
S795 Phosphorylation
S802 Phosphorylation
Y810 Phosphorylation
S811 Phosphorylation
S839 Phosphorylation
S852 Phosphorylation P17612 (PRKACA) , O75116 (ROCK2) , Q13976 (PRKG1) , Q9Y5S2 (CDC42BPB) , Q13464 (ROCK1)
T853 Phosphorylation P17612 (PRKACA) , Q13464 (ROCK1) , Q04759 (PRKCQ)
S856 Phosphorylation
T859 Phosphorylation
S862 Phosphorylation
S871 Phosphorylation
T873 Phosphorylation
S877 Phosphorylation
T884 Phosphorylation
S886 Phosphorylation
S888 Phosphorylation
Y890 Phosphorylation
T892 Phosphorylation
S893 Phosphorylation
S894 Phosphorylation
S896 Phosphorylation
Y901 Phosphorylation
S903 Phosphorylation
S908 Phosphorylation
S910 Phosphorylation O60285 (NUAK1)
Y911 Phosphorylation
S912 Phosphorylation
Y913 Phosphorylation
Y920 Phosphorylation
S921 Phosphorylation
S922 Phosphorylation
Y936 Phosphorylation
K945 Ubiquitination
S978 Phosphorylation
S995 Phosphorylation
K1002 Methylation
K1008 Methylation
S1029 Phosphorylation

研究背景

功能:

Key regulator of protein phosphatase 1C (PPP1C). Mediates binding to myosin. As part of the PPP1C complex, involved in dephosphorylation of PLK1. Capable of inhibiting HIF1AN-dependent suppression of HIF1A activity.

翻译修饰:

Phosphorylated by CIT (Rho-associated kinase) (By similarity). Phosphorylated cooperatively by ROCK1 and CDC42BP on Thr-696. Phosphorylated on upon DNA damage, probably by ATM or ATR. In vitro, phosphorylation of Ser-695 by PKA and PKG appears to prevent phosphorylation of the inhibitory site Thr-696, probably mediated by PRKG1. Phosphorylation at Ser-445, Ser-472 and Ser-910 by NUAK1 promotes interaction with 14-3-3, leading to inhibit interaction with myosin light chain MLC2, preventing dephosphorylation of MLC2. May be phosphorylated at Thr-696 by DMPK; may inhibit the myosin phosphatase activity. Phosphorylated at Ser-473 by CDK1 during mitosis, creating docking sites for the POLO box domains of PLK1. Subsequently, PLK1 binds and phosphorylates PPP1R12A.

细胞定位:

Cytoplasm. Cytoplasm>Cytoskeleton>Stress fiber.
Note: Also along actomyosin filaments.

Extracellular region or secreted Cytosol Plasma membrane Cytoskeleton Lysosome Endosome Peroxisome ER Golgi apparatus Nucleus Mitochondrion Manual annotation Automatic computational assertionSubcellular location
组织特异性:

Expressed in striated muscles, specifically in type 2a fibers (at protein level).

亚基结构:

PP1 comprises a catalytic subunit, PPP1CA, PPP1CB or PPP1CC, and one or several targeting or regulatory subunits. PPP1R12A mediates binding to myosin. Interacts with ARHA and CIT (By similarity). Binds PPP1R12B, ROCK1 and IL16. Interacts directly with PRKG1. Non-covalent dimer of 2 dimers; PRKG1-PRKG1 and PPP1R12A-PPP1R12A. Interacts with SMTNL1 (By similarity). Interacts with PPP1CB; the interaction is direct. Interacts (when phosphorylated at Ser-445, Ser-472 and Ser-910) with 14-3-3. Interacts with ROCK1 and ROCK2. Interacts with isoform 1 and isoform 2 of ZIPK/DAPK3. Interacts with RAF1. Interacts with HIF1AN. Interacts with NCKAP1L.

蛋白家族:

Heterotetramerization is mediated by the interaction between a coiled-coil of PRKG1 and the leucine/isoleucine zipper of PPP1R12A/MBS, the myosin-binding subunit of the myosin phosphatase.

The KVKF motif mediates interaction with PPP1CB.

研究领域

· Cellular Processes > Cellular community - eukaryotes > Focal adhesion.   (View pathway)

· Cellular Processes > Cell motility > Regulation of actin cytoskeleton.   (View pathway)

· Environmental Information Processing > Signal transduction > cGMP-PKG signaling pathway.   (View pathway)

· Environmental Information Processing > Signal transduction > cAMP signaling pathway.   (View pathway)

· Human Diseases > Cancers: Overview > Proteoglycans in cancer.

· Organismal Systems > Circulatory system > Vascular smooth muscle contraction.   (View pathway)

· Organismal Systems > Immune system > Platelet activation.   (View pathway)

· Organismal Systems > Endocrine system > Oxytocin signaling pathway.

文献引用

1). AMPK is a mechano-metabolic sensor linking cell adhesion and mitochondrial dynamics to Myosin-dependent cell migration. Nature Communications, 2023 (PubMed: 37217519) [IF=16.6]

Application: WB    Species: Human    Sample: A375P cells

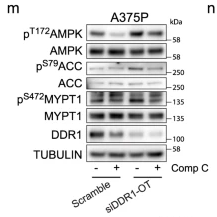
Fig. 4: ATP levels control plasticity of cell migration through AMPK. a AMP, ATP/AMP and ATP/ADP in A375P cells treated with rotenone (0.5 μM) and antimycin A (0.5 μM) (5 replicates/condition). b Western blot for the same conditions as in (a). c Western blot of the indicated proteins (WM983 n = 6, A375 n = 5). d Western blot upon AMPK knock-down (n = 3). e Cells grown on a collagen I matrix. Immunofluorescence images showing pMLC2 (green) and F-actin (red) (n = 3). Scale bar = 5 μm. f–h Quantification of cell morphology (211, 193 cells pooled from n = 3) (f), pMLC2 immunofluorescence signal normalized by cell area (52, 66 cells pooled from n = 3) (g) and representative traction stress (n = 3). Colour bar indicates traction stress magnitude (Pascal, Pa), scale bar = 20 μm (h). i Western blot upon AMPK activation (A769662 10 μM, 30 minutes) (n = 5). j–l Cells grown on a collagen I matrix. Immunofluorescence images showing pMLC2 (green) and F-actin (red) after A769662 treatment (10 μM, 24 h) (n = 3), scale bar = 10 μm (j); quantification of cell morphology (317, 283 cells pooled from n = 3) (k) and quantification of pMLC2 immunofluorescence signal normalized by cell area (81, 84 cells pooled from n = 3) (l). m, n Western blot and quantification after DDR1 knock-down and Comp C treatment (2 μM, 24 h) (n = 8 AMPK, n = 6 ACC, n = 9 MYPT1). o–q Cells grown on a collagen I matrix. Immunofluorescence images showing pMLC2 (green) and F-actin (red) (n = 3), scale bar = 10 μm (o); quantification of cell morphology (274, 210, 274, 191 cells pooled from n = 3) (p) and quantification of pMLC2 immunofluorescence signal normalized by cell area (93, 84, 94, 93 cells pooled from n = 3) (q). Quantification versus corresponding total protein (b, c, d, i). Graphs (a, n) show mean ± SEM. Violin plots (f, k, p) show median with interquartile range. Box plots (g, l, q) show median (centre line), interquartile range (box) and min-max values (whiskers). p values were calculated using two-tailed tests (f, g, k, l). p value by Mann–Whitney test (f, g, k, l), one-way ANOVA with Dunnett’s correction (a) or Tukey’s multiple test (n) and Kruskal-Wallis with Dunn’s multiple comparisons test (p, q). All n are indicative of independent experiments unless otherwise stated. Source data are provided as a Source Data file.

2). AMPK is a Mechano-Metabolic Sensor Linking Mitochondrial Dynamics to Myosin II Dependent Cell Migration. , 2021

3). AMPK is a mechano-metabolic sensor linking cell adhesion and mitochondrial dynamics to Myosin II dependent cell migration. , 2022

Application: WB    Species: Mouse    Sample: WM983B and A375M2 cells

Figure 4: Energy levels control plasticity of cell migration through AMPK signalling. A-B) Western blot (A) and quantification (B) of AMPK and MYPT1 phosphorylation in rounded-amoeboid versus elongated-mesenchymal cells (n=3). C) Upon AMPK inhibition (Compound C (Comp C) 2 mM, 24 hours) in WM983B and A375M2 cells, western blot showing levels of AMPK and MYPT1 phosphorylation (n=3). Quantification normalized by total AMPK and MYPT1, respectively. D) Cells grown on a collagen I matrix. Immunofluorescence images showing pMLC2 (green) and F-actin (red) after Comp C treatment (2 mM, 24 hours). Scale bar = 10 mm. E-F) After Comp C treatment, quantification of cell morphology (>200 cells pooled from 3 experiments) (E) and quantification of pMLC2 immunofluorescence signal normalized by cell area (>90 cells pooled from 3 experiments) (F). G) Upon AMPK activation (A769662 10 mM, 30 minutes) in WM983A and A375P cells, western blot showing levels of AMPK and MYPT1 phosphorylation (n=3). Quantification normalized by total AMPK and MYPT1, respectively. H) Cells grown on a collagen I matrix. Immunofluorescence images showing pMLC2 (green) and F-actin (red) after A769662 treatment (10 mM, 24 hours). Scale bar = 10 mm. I-J) After A769662 treatment, quantification of cell morphology (>200 cells pooled from 3 experiments) (I) and quantification of pMLC2 immunofluorescence signal normalized by cell area (>90 cells pooled from 3 experiments) (J). K-L) Western blot (K) and quantification (L) of AMPK and MYPT1 phosphorylation levels after DDR1 knockdown and treatment with Comp C (2 mM, 24 hours) in A375P cells (n=3). M) Cells grown on a collagen I matrix. Immunofluorescence images showing pMLC2 (green) and F-actin (red) after DDR1 knock-down and Comp C treatment (2 mM, 24 hours). Scale bar = 10 mm. N-O) After DDR1 knock-down and Comp C treatment, quantification of cell morphology (>200 cells pooled from 3 experiments) (N) and quantification of pMLC2 immunofluorescence signal normalized by cell area (>90 cells pooled from 3 experiments) (O). Graphs (B, L) show mean ± SEM. Dot plots (E, I, N) show median with interquartile range (each dot represents a single cell). Box plots (F, J, O) show min to max. p value by paired t-test (B), Mann-Whitney test (E, F, I, J), one-way ANOVA with Dunnett’s correction (L) and Kruskal-Wallis with Dunn’s multiple comparisons test (N, O). For all graphs, *p

限制条款

产品的规格、报价、验证数据请以官网为准,官网链接:www.affbiotech.com | www.affbiotech.cn(简体中文)| www.affbiotech.jp(日本語)

产品的数据信息为Affinity所有,未经授权不得收集Affinity官网数据或资料用于商业用途,对抄袭产品数据的行为我们将保留诉诸法律的权利。

产品相关数据会因产品批次、产品检测情况随时调整,如您已订购该产品,请以订购时随货说明书为准,否则请以官网内容为准,官网内容有改动时恕不另行通知。

Affinity保证所销售产品均经过严格质量检测。如您购买的商品在规定时间内出现问题需要售后时,请您在Affinity官方渠道提交售后申请。

产品仅供科学研究使用。不用于诊断和治疗。 

产品未经授权不得转售。

Affinity Biosciences将不会对在使用我们的产品时可能发生的专利侵权或其他侵权行为负责。Affinity Biosciences, Affinity Biosciences标志和所有其他商标所有权归Affinity Biosciences LTD.