产品: LHX1 抗体
货号: DF4823
描述: Rabbit polyclonal antibody to LHX1
应用: WB IHC IF/ICC
文献验证: WB, IF/ICC
反应: Human, Mouse, Rat
预测: Pig, Zebrafish, Bovine, Horse, Sheep, Rabbit, Dog, Chicken, Xenopus
分子量: 44 KD; 45kD(Calculated).
蛋白号: P48742
RRID: AB_2837188

浏览相似产品>>

   规格 价格 库存
 50ul RMB¥ 1250 现货
 100ul RMB¥ 2300 现货
 200ul RMB¥ 3000 现货

货期: 当天发货

联系销售

产品描述

来源:
Rabbit
应用:
WB 1:500-1:1000, IHC 1:50-1:200, IF/ICC 1:100-1:500
*The optimal dilutions should be determined by the end user.
*Tips:

WB: 适用于变性蛋白样本的免疫印迹检测. IHC: 适用于组织样本的石蜡(IHC-p)或冰冻(IHC-f)切片样本的免疫组化/荧光检测. IF/ICC: 适用于细胞样本的荧光检测. ELISA(peptide): 适用于抗原肽的ELISA检测.

反应:
Human,Mouse,Rat
预测:
Pig(91%), Zebrafish(82%), Bovine(91%), Horse(91%), Sheep(91%), Rabbit(91%), Dog(91%), Chicken(91%), Xenopus(91%)
克隆:
Polyclonal
特异性:
LHX1 Antibody detects endogenous levels of total LHX1.
RRID:
AB_2837188
引用格式: Affinity Biosciences Cat# DF4823, RRID:AB_2837188.
偶联:
Unconjugated.
纯化:
The antiserum was purified by peptide affinity chromatography using SulfoLink™ Coupling Resin (Thermo Fisher Scientific).
保存:
Rabbit IgG in phosphate buffered saline , pH 7.4, 150mM NaCl, 0.02% sodium azide and 50% glycerol. Store at -20 °C. Stable for 12 months from date of receipt.
别名:

展开/折叠

hLim-1; Homeo box protein Lim 1; Homeo box protein Lim1; Homeobox protein Lim 1; Homeobox protein Lim-1; Homeobox protein Lim1; LHX 1; LHX1; LHX1_HUMAN; LIM 1; LIM homeo box 1; LIM homeo box protein 1; LIM homeobox 1; LIM homeobox protein 1; LIM-1; LIM/homeobox protein Lhx 1; LIM/homeobox protein Lhx1; MGC126723; MGC138141;

抗原和靶标

免疫原:
Uniprot:
基因/基因ID:
表达:
P48742 LHX1_HUMAN:

Expressed in the brain, thymus, and tonsils. Expressed in samples from patients with chronic myeloid leukemia (CML) and in 58% of acute myeloid leukemia (AML) cell lines.

序列:
MVHCAGCKRPILDRFLLNVLDRAWHVKCVQCCECKCNLTEKCFSREGKLYCKNDFFRCFGTKCAGCAQGISPSDLVRRARSKVFHLNCFTCMMCNKQLSTGEELYIIDENKFVCKEDYLSNSSVAKENSLHSATTGSDPSLSPDSQDPSQDDAKDSESANVSDKEAGSNENDDQNLGAKRRGPRTTIKAKQLETLKAAFAATPKPTRHIREQLAQETGLNMRVIQVWFQNRRSKERRMKQLSALGARRHAFFRSPRRMRPLVDRLEPGELIPNGPFSFYGDYQSEYYGPGGNYDFFPQGPPSSQAQTPVDLPFVPSSGPSGTPLGGLEHPLPGHHPSSEAQRFTDILAHPPGDSPSPEPSLPGPLHSMSAEVFGPSPPFSSLSVNGGASYGNHLSHPPEMNEAAVW

种属预测

种属预测:

score>80的预测可信度较高,可尝试用于WB检测。*预测模型主要基于免疫原序列比对,结果仅作参考,不作为质保凭据。

Species
Results
Score
Pig
91
Horse
91
Bovine
91
Sheep
91
Dog
91
Xenopus
91
Chicken
91
Rabbit
91
Zebrafish
82
Model Confidence:
High(score>80) Medium(80>score>50) Low(score<50) No confidence

翻译修饰 - P48742 作为底物

Site PTM Type Enzyme
K48 Sumoylation
S71 Phosphorylation
S162 Phosphorylation

研究背景

功能:

Potential transcription factor. May play a role in early mesoderm formation and later in lateral mesoderm differentiation and neurogenesis.

细胞定位:

Nucleus.

Extracellular region or secreted Cytosol Plasma membrane Cytoskeleton Lysosome Endosome Peroxisome ER Golgi apparatus Nucleus Mitochondrion Manual annotation Automatic computational assertionSubcellular location
组织特异性:

Expressed in the brain, thymus, and tonsils. Expressed in samples from patients with chronic myeloid leukemia (CML) and in 58% of acute myeloid leukemia (AML) cell lines.

亚基结构:

Interacts with LDB1 via the tandem LIM domains.

蛋白家族:

The LIM domains exert a negative regulatory function and disruption of the LIM domains produces an activated form. In addition, two activation domains and a negative regulatory domain exist C-terminally to the homeobox (By similarity).

文献引用

1). BUB1 drives the occurrence and development of bladder cancer by mediating the STAT3 signaling pathway. JOURNAL OF EXPERIMENTAL & CLINICAL CANCER RESEARCH, 2021 (PubMed: 34852826) [IF=11.3]

2). Degradation of Different Molecular Weight Fucoidans and Their Inhibition of TGF-β1 Induced Epithelial-Mesenchymal Transition in Mouse Renal Tubular Epithelial Cells. International Journal of Biological Macromolecules, 2020 (PubMed: 32057857) [IF=7.7]

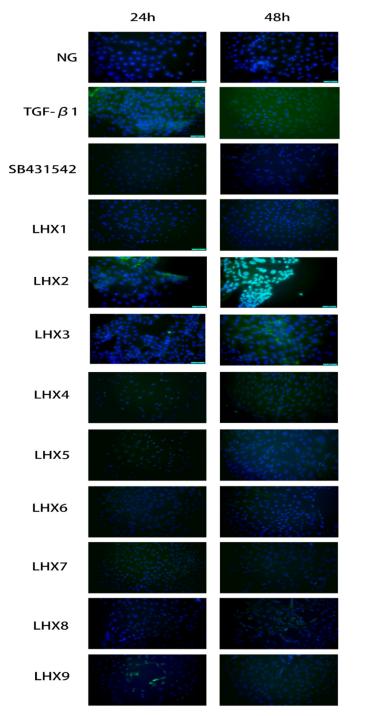
Application: IF/ICC    Species: Mouse    Sample: MTEC cells

Fig. 7. The result of cell immunofluorescence assay after LHXs and TGF-β1 treated MTEC for 24 and 48 h. Representative images (3 visual fields for each tissue analyzed) of immunolabeling for Fn and nuclear staining with DAPI. Scale bar, 50 ~μm.

3). Long non-coding RNA LHX1-DT regulates cardiomyocyte differentiation through H2A.Z-mediated LHX1 transcriptional activation. iScience, 2023 (PubMed: 37942009)

Application: WB    Species: Human    Sample:

Figure 4 LHX1-DT enhances LHX1 expression to promote cardiac differentiation (A) Schematic representation of the LHX1-DT and LHX1 gene locus and their sequence conservation analysis from UCSC genome browser. Red and blue arrows indicate the direction of transcription of LHX1-DT and LHX1 respectively. (B) Genome browser track of the selected genomic regions around LHX1-DT and LHX1. The gray shadow rectangle showing the expression levels and ATAC signals of LHX1-DT and LHX1 at the four stages of cardiac development. (C) qRT-PCR analysis of LHX1-DT and LHX1 expression during cardiac differentiation, n = 4. (D) Localization of LHX1-DT and LHX1 in mesodermal cells derived from hESCs by FISH study. Scale bars, 20 μm, n = 4. (E) Western blot analysis of LHX1 in undifferentiated and in mesoderm differentiating cells with LHX1-DT knockdown. ∗∗p < 0.01, n = 3. (F) qRT-PCR analysis of LHX1 expression in differentiating hESCs 2 days following siRNA transfection of cardiac differentiation. ∗∗∗p < 0.001, n = 4. (G and H) qRT-PCR analysis of the expression levels of LHX1-DT and mesoderm markers (T and Mesp1) on Day 2 and cardiomyocyte markers (cTnT, α-actinin, NKX2.5, and MYL7) on Day 10 in LHX1-DT depleted hESCs. ∗∗∗p < 0.001, n = 4. (I) Immunostaining of cTnT (green) and α-actinin (red) in LHX1 knockdown and siNC cells on Day 10 of CM differentiation. Scale bar, 50 μm, n = 4. (J) Representative flow cytometry analysis of the percentage of cTnT-positive cardiomyocytes between siLHX1 and siNC group. ∗∗∗p < 0.001, n = 3. (K) qRT-PCR analysis of cardiac marker genes expression on Day 10 in LHX1-DT+/+, LHX1-DT−/−, and LHX1-DT−/− + LHX1 cells. ∗p < 0.05, ∗∗p < 0.01, ∗∗∗p < 0.001 vs. LHX1-DT+/+, n = 4. ##p < 0.01, ###p < 0.001 vs. LHX1-DT−/−, n = 4. (L) Immunostaining of cTnT (green) and α-actinin (red) in LHX1-DT+/+, LHX1-DT−/−, and LHX1-DT−/− + LHX1 cells on Day 10 of CM differentiation. Scale bar, 50 μm. Scale bars, 50 μm, n = 4. (M) Representative flow cytometry analysis of the percentage of cTnT-positive cells in LHX1-DT+/+, LHX1-DT−/−, and LHX1-DT−/− + LHX1 cardiomyocytes. ∗∗∗p < 0.001 vs. LHX1-DT+/+, ###p < 0.001 vs. LHX1-DT−/−, n = 3. Data are presented as mean ± SEM.

Application: IF/ICC    Species: Human    Sample:

Figure 4 LHX1-DT enhances LHX1 expression to promote cardiac differentiation (A) Schematic representation of the LHX1-DT and LHX1 gene locus and their sequence conservation analysis from UCSC genome browser. Red and blue arrows indicate the direction of transcription of LHX1-DT and LHX1 respectively. (B) Genome browser track of the selected genomic regions around LHX1-DT and LHX1. The gray shadow rectangle showing the expression levels and ATAC signals of LHX1-DT and LHX1 at the four stages of cardiac development. (C) qRT-PCR analysis of LHX1-DT and LHX1 expression during cardiac differentiation, n = 4. (D) Localization of LHX1-DT and LHX1 in mesodermal cells derived from hESCs by FISH study. Scale bars, 20 μm, n = 4. (E) Western blot analysis of LHX1 in undifferentiated and in mesoderm differentiating cells with LHX1-DT knockdown. ∗∗p < 0.01, n = 3. (F) qRT-PCR analysis of LHX1 expression in differentiating hESCs 2 days following siRNA transfection of cardiac differentiation. ∗∗∗p < 0.001, n = 4. (G and H) qRT-PCR analysis of the expression levels of LHX1-DT and mesoderm markers (T and Mesp1) on Day 2 and cardiomyocyte markers (cTnT, α-actinin, NKX2.5, and MYL7) on Day 10 in LHX1-DT depleted hESCs. ∗∗∗p < 0.001, n = 4. (I) Immunostaining of cTnT (green) and α-actinin (red) in LHX1 knockdown and siNC cells on Day 10 of CM differentiation. Scale bar, 50 μm, n = 4. (J) Representative flow cytometry analysis of the percentage of cTnT-positive cardiomyocytes between siLHX1 and siNC group. ∗∗∗p < 0.001, n = 3. (K) qRT-PCR analysis of cardiac marker genes expression on Day 10 in LHX1-DT+/+, LHX1-DT−/−, and LHX1-DT−/− + LHX1 cells. ∗p < 0.05, ∗∗p < 0.01, ∗∗∗p < 0.001 vs. LHX1-DT+/+, n = 4. ##p < 0.01, ###p < 0.001 vs. LHX1-DT−/−, n = 4. (L) Immunostaining of cTnT (green) and α-actinin (red) in LHX1-DT+/+, LHX1-DT−/−, and LHX1-DT−/− + LHX1 cells on Day 10 of CM differentiation. Scale bar, 50 μm. Scale bars, 50 μm, n = 4. (M) Representative flow cytometry analysis of the percentage of cTnT-positive cells in LHX1-DT+/+, LHX1-DT−/−, and LHX1-DT−/− + LHX1 cardiomyocytes. ∗∗∗p < 0.001 vs. LHX1-DT+/+, ###p < 0.001 vs. LHX1-DT−/−, n = 3. Data are presented as mean ± SEM.

限制条款

产品的规格、报价、验证数据请以官网为准,官网链接:www.affbiotech.com | www.affbiotech.cn(简体中文)| www.affbiotech.jp(日本語)

产品的数据信息为Affinity所有,未经授权不得收集Affinity官网数据或资料用于商业用途,对抄袭产品数据的行为我们将保留诉诸法律的权利。

产品相关数据会因产品批次、产品检测情况随时调整,如您已订购该产品,请以订购时随货说明书为准,否则请以官网内容为准,官网内容有改动时恕不另行通知。

Affinity保证所销售产品均经过严格质量检测。如您购买的商品在规定时间内出现问题需要售后时,请您在Affinity官方渠道提交售后申请。

产品仅供科学研究使用。不用于诊断和治疗。 

产品未经授权不得转售。

Affinity Biosciences将不会对在使用我们的产品时可能发生的专利侵权或其他侵权行为负责。Affinity Biosciences, Affinity Biosciences标志和所有其他商标所有权归Affinity Biosciences LTD.